The Earth Observer Editor’s Corner: Fall 2024
On September 18, 2024, the National Oceanic and Atmospheric Administration (NOAA) shared the first images of the Western Hemisphere from the GOES-19 satellite, its newest geostationary satellite launched on June 25, 2024 onboard a Falcon Heavy rocket from NASA’s Kennedy Space Center. Previously known as GOES-U, the satellite was renamed GOES-19 upon reaching geostationary orbit on […]
9 min read
The Earth Observer Editor’s Corner: Fall 2024
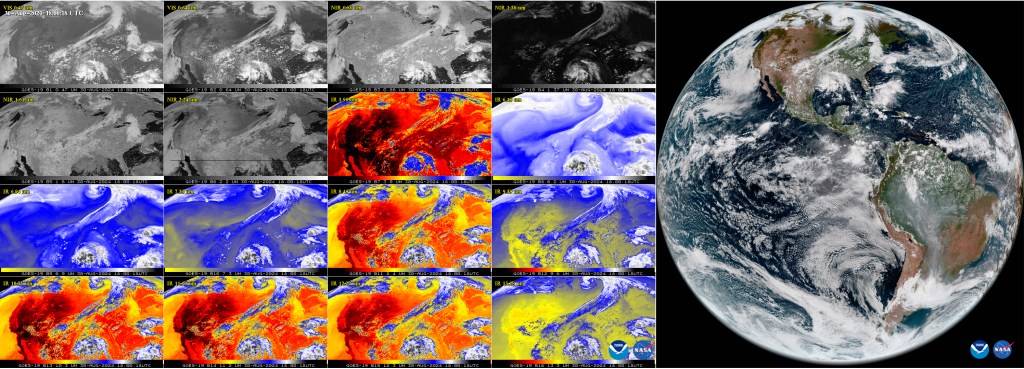
On September 18, 2024, the National Oceanic and Atmospheric Administration (NOAA) shared the first images of the Western Hemisphere from the GOES-19 satellite, its newest geostationary satellite launched on June 25, 2024 onboard a Falcon Heavy rocket from NASA’s Kennedy Space Center. Previously known as GOES-U, the satellite was renamed GOES-19 upon reaching geostationary orbit on July 7, 2024. GOES-19 orbits about 35,785 km above the equator at the same speed the Earth rotates, allowing the satellite to constantly view the same area of the planet and track weather conditions and hazards as they happen. The satellite’s Advanced Baseline Imager (ABI) instrument recently captured stunning views of Earth in 16 spectral channels. This data provides researchers information about Earth’s atmosphere, land, and ocean for short-term forecasts and tracking severe weather – see Figure. ABI data is also used for detecting and monitoring environmental hazards, such as wildfires, smoke, dust storms, volcanic eruptions, turbulence, and fog. Data from multiple ABI channels can be combined to create imagery that approximates what the human eye would see from space referred to as GeoColor (see Figure).

GOES-19 is the final satellite in NOAA’s GOES-R series and serves as a bridge to a new age of advanced satellite technology. NOAA and NASA are currently developing NOAA’s next generation geostationary satellites, called Geostationary Extended Observations (GeoXO), to advance operational geostationary Earth observations.
NASA Earth sciences celebrated several satellite milestone anniversaries in 2024. The Global Precipitation Measurement (GPM) Core Observatory (CO) celebrated its 10th anniversary in February while Aura and Orbiting Carbon Observatory–2 (OCO–2) celebrated their 20th and 10th anniversaries, respectively, in July. Here, we focus on GPM and Aura.
The GPM CO launched on February 27, 2024, aboard a Japanese H-IIA rocket from Tanegashima Space Center in southern Japan, as a joint Earth-observing mission between NASA and the Japan Aerospace Exploration Agency (JAXA). To celebrate its 10th anniversary, GPM has been hosting special outreach activities. One example is the GPM 10-in-10 webinar series that began on February 8, 2024. This series of 10 public webinars explores GPM and the story behind the mission, which is aimed at anyone interested in science, technology, engineering, mathematics, and the synergy of these disciplines to better understand and protect our home planet.
Now over 10 years into the mission, GPM continues to provide important data on precipitation around the globe leading to new scientific discoveries and contributing data to help society, from monitoring storms to supporting weather forecasts and aiding water-borne disease public health alerts.
As an example, GPM made several passes of Hurricane Milton, which made landfall near Siesta Key, FL on October 9, 2024 as a Category 3 storm. As a complement to GPM CO observations, a multi-satellite sensor IMERG animation shows rainfall rates and accumulation over the course of Milton’s history.
To read more about how GPM continues to observe important precipitation characteristics and gain physical insights into precipitation processes, please see the article “GPM Celebrates Ten Years of Observing Precipitation for Science and Society” in The Earth Observer.
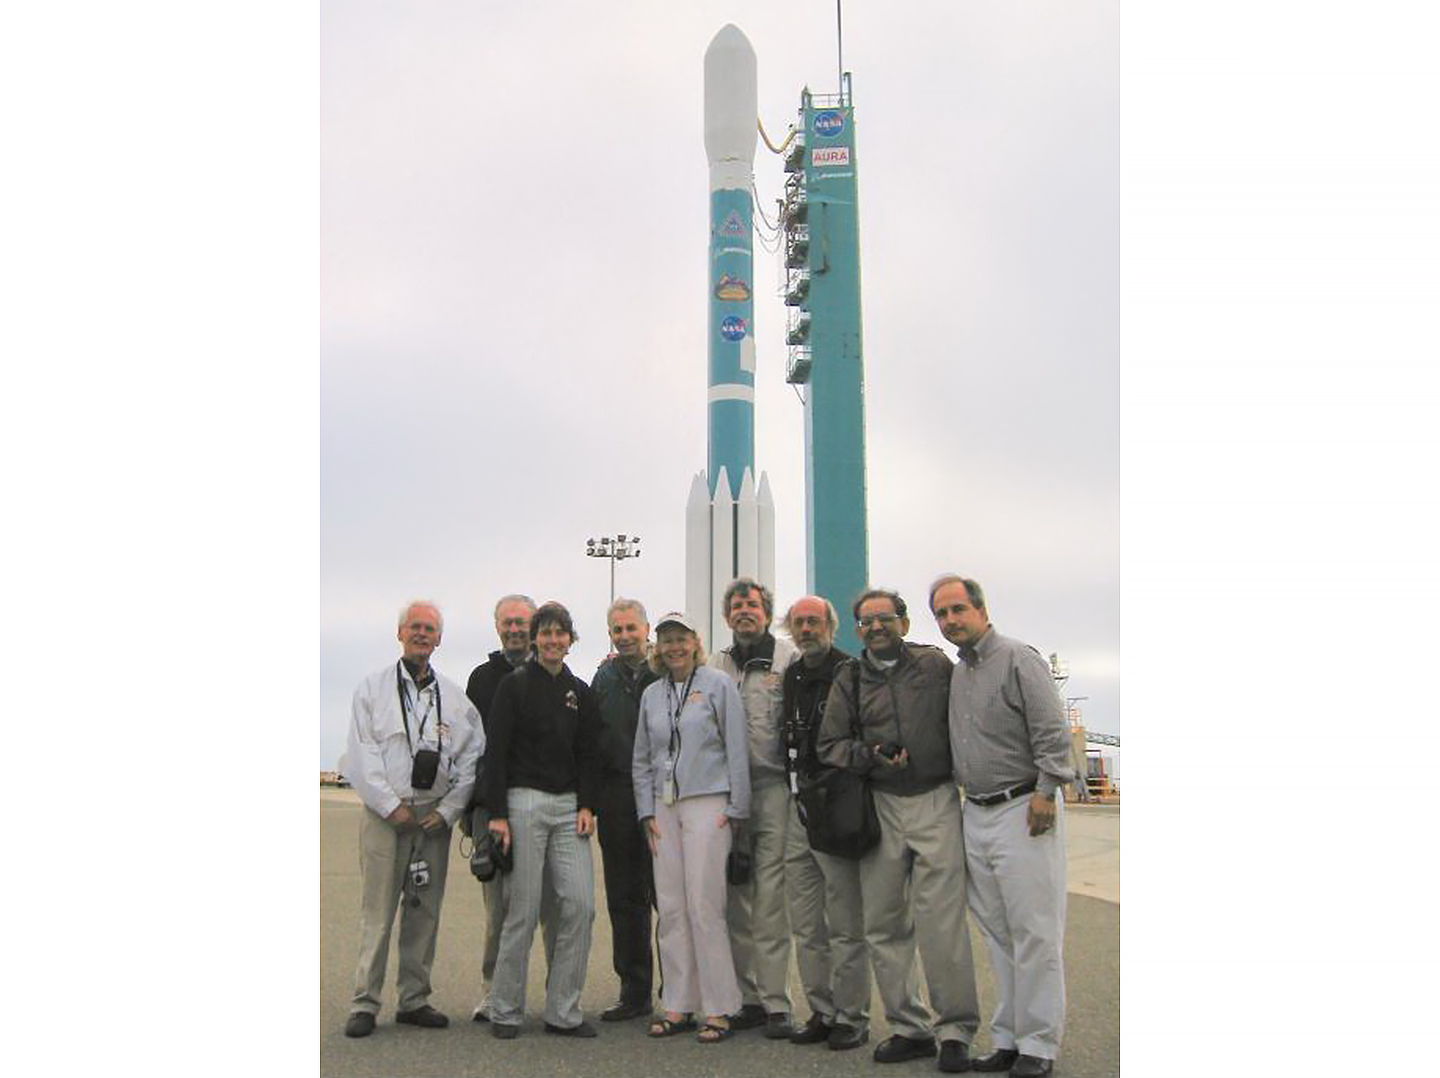
The last of NASA’s three EOS Flagships – Aura – marked 20 years in orbit on July 15, 2024, with a celebration on September 18, 2024, at Goddard Space Flight Center’s (GSFC) Recreational Center. The 120 attendees – including about 40 participating virtually – reminisced about Aura’s (originally named EOS-CHEM) tumultuous beginning, from the instrument and Principal Investigator (PI) selections up until the delayed launch at Vandenberg Space Force Base (then Air Force Base) in California. They remembered how Bill Townsend, who was Deputy Director of GSFC at the time, and Ghassem Asrar, who was NASA’s Associate Administrator for Earth Science, spent many hours on site negotiating with the Vandenberg and Boeing launch teams in preparation for launch (after several delays and aborts). Photo 1 shows the Aura mission program scientist, project scientists (PS), and several instrument principal investigators (PI) at Vandenberg shortly before launch.
At the anniversary event, Bryan Duncan [GSFC—Aura Project Scientist] gave formal opening remarks. Aura’s datasets have given a generation of scientists the most comprehensive global view of gases in Earth’s atmosphere to better understand the chemical and dynamic processes that shape their concentrations. Aura’s objective was to gather data to monitor Earth’s ozone layer, examine trends in global air pollutants, and measure the concentration of atmospheric constituents contributing to climate forcing. To read more about Aura’s incredible 20 years of accomplished air quality and climate science, see the anniversary article “Aura at 20 Years” in The Earth Observer.
To read more about the anniversary event, see Summary of Aura 20th Anniversary Event.
It has been over a year and a half since the Surface Water and Ocean Topography (SWOT) mission began collecting data on the height of nearly all water on Earth’s surface, including oceans, lakes, rivers, and reservoirs. During that time, data collected by the satellite has started to improve our understanding of energy in the ocean, yielding insights on surface currents and waves, internal tides, the vertical mixing of seawater, as well as atmosphere–ocean interactions. Notably, SWOT has been measuring the amplitude of solitary internal waves in the ocean. These waves reflect the dynamics of internal tides (tides that occur deep in the ocean rather than at the surface) that can influence biological productivity as well as ocean energy exchanges through their contribution to mixing and general oceanic circulation.
SWOT measurements are also being used to study inland and coastal flooding to inform water management strategies. Earlier this year, researchers used SWOT data to measure the total volume of water during major floods in southern Brazil in April to improve understanding of these events and prepare for the future. In addition, the Water Ministry of Bangladesh is working to incorporate SWOT water elevation maps, along with other near-real time satellite data, into their flood forecasts. Researchers at Alexandria University, Egypt are using SWOT data in the Nile River Basin to improve dam operations. A detailed account of SWOT Significant Events since launch is available online. To learn more about project status and explore the many facets of operational and applied uses of SWOT data, please see The Earth Observer article, “Summary of the 10th SWOT Applications Workshop.”
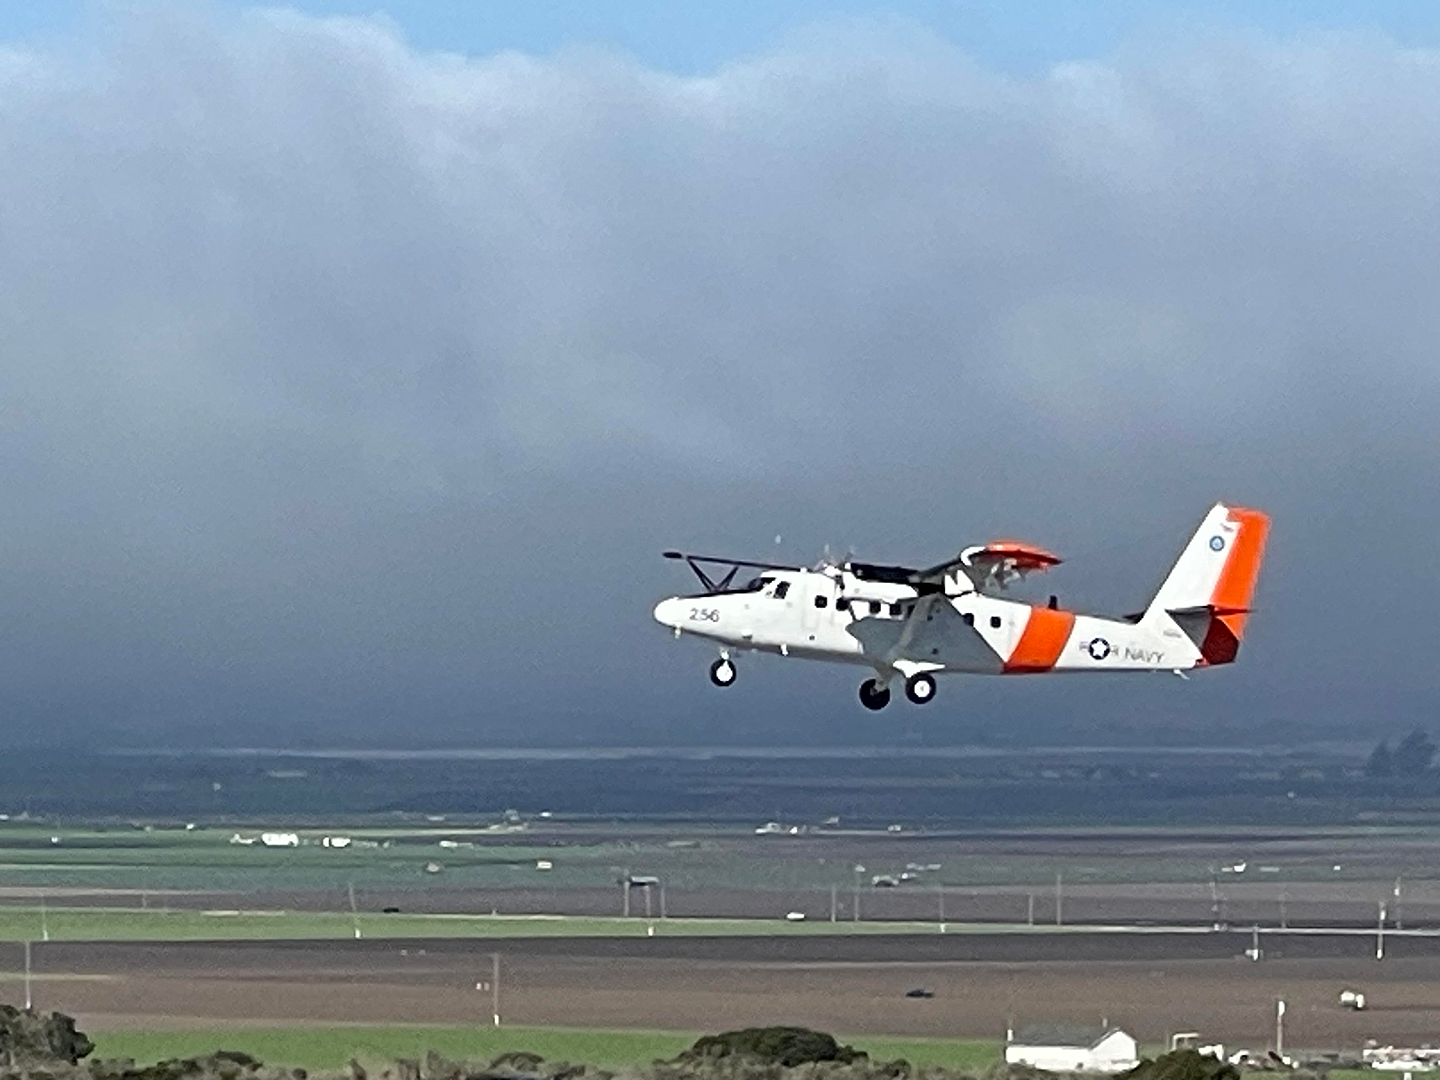
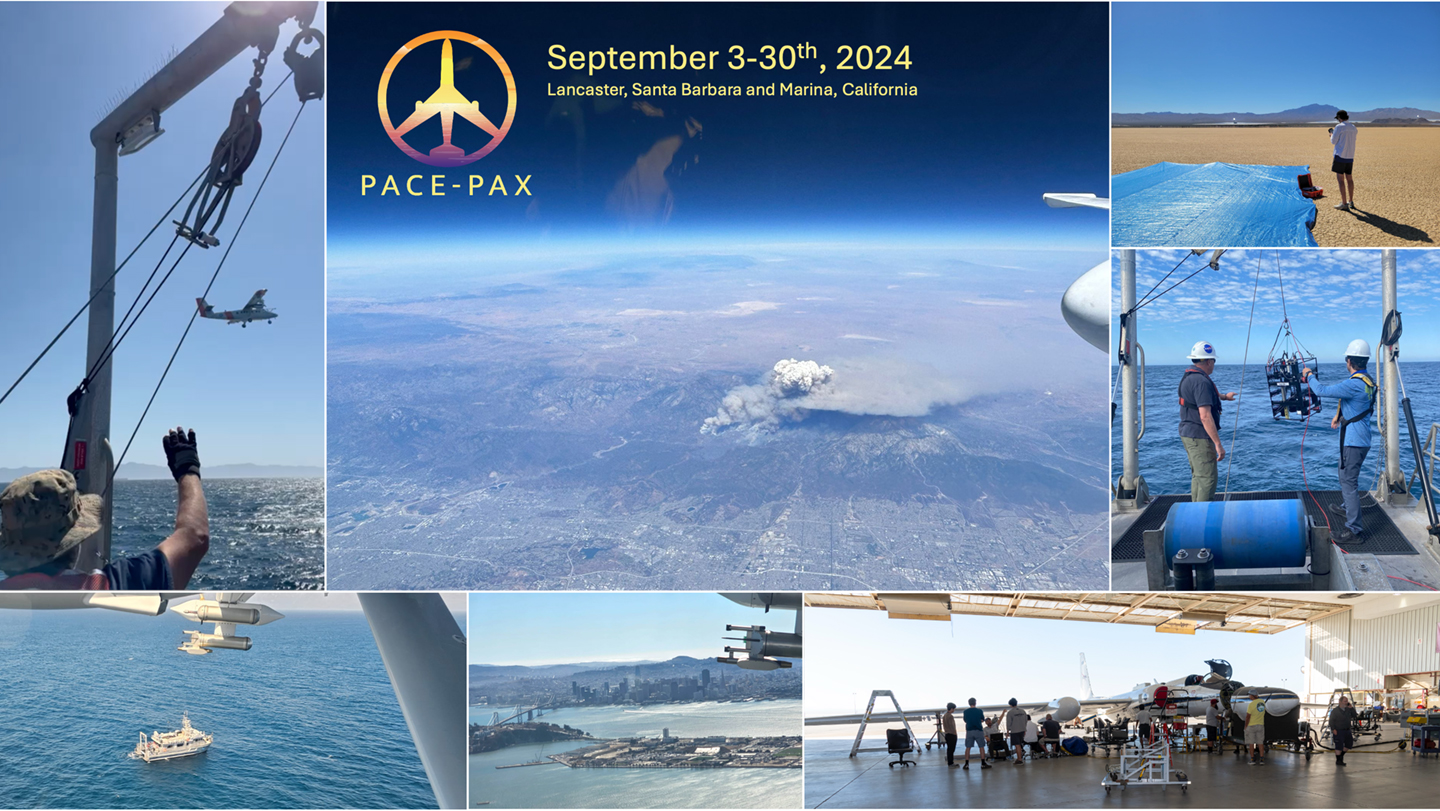
In September 2024, the Plankton, Aerosol, Cloud, ocean Ecosystem–Postlaunch Airborne eXperiment (PACE–PAX) gathered data for the validation of the PACE mission, which launched in February 2024. The operations spanned Southern and Central California and nearby coastal regions, logging 81 flight hours for the NASA ER-2, which operated out of NASA’s Armstrong Flight Research Center (AFRC) in Edwards, CA, and 60 hours for Twin Otter aircraft, which was operated by the Center for Interdisciplinary Remotely Piloted Aircraft Studies (CIRPAS) at the Naval Postgraduate School (Monterey, CA) out of Marina Municipal Airport in Marina, CA – see Photo 2.
Congratulations to PACE-PAX leads Kirk Knobelspiesse [GSFC], Brian Cairns [NASA Goddard Institute for Space Studies (GISS)], and Ivona Cetinić [GSFC/Morgan State University] for successfully executing and planning this campaign. PACE–PAX data will be available in March 2025 via NASA’s Langley Research Center Suborbital Science Data for Atmospheric Composition website and NASA’s SeaWiFS Bio-optical Archive and Storage System (SeaBASS).
Shifting venues, NASA’s BlueFlux Campaign conducted a series of ground-based and airborne fieldwork missions out of the Miami Homestead Air Reserve Base and the Miami Executive Airport in Miami-Dade County, which are adjacent to the eastern border of the Everglades National Park. The full study region – broadly referred to as South Florida – is narrowly defined by the wetland ecosystems that extend from Lake Okeechobee and its Northern estuaries to the saltwater marshland and mangrove forests along the state’s southernmost shore.
Glenn Wolfe [GSFC] and Erin Delaria [GSFC/UMD] organized more than 34 flights across 5 separate fieldwork deployments during the campaign. The data during BlueFlux are intended to contribute to a more robust understanding of how Florida’s coastal ecology fits into the carbon cycle. The article, “NASA’s BlueFlux Campaign Supports Blue Carbon Management in South Florida,” provides additional information about this program, which was made possible by David Lagomasino [East Carolina University], Cheryl Doughty [GSFC/UMD], Lola Fatoyinbo [GSFC], and Peter Raymond [Yale University].
To learn more about PACE-PAX and BlueFlux, see: Updates on NASA Field Campaigns.
Notable recent Science Support Office (SSO) outreach activities include the 2024 Eclipse outreach and engagement efforts on April 7, 2024, in Kerrville, TX and Cleveland, OH. The two locations are among a dozen that NASA set up along path of totality. To read about the 2024 Total Solar Eclipse through the eyes of NASA outreach and engagement activities, please see The Earth Observer feature article, “Looking Back on Looking Up: The 2024 Total Solar Eclipse.”
The SSO also supported the United Nations (UN) Summit of the Future event and the 79th General Assembly High Level week, September 19–27, 2024 at UN Headquarters (HQ) in New York City, NY. SSO supported the NASA Sea Level Change Team (N-SLCT) during the High-level Meeting on Sea-Level Rise by having Hyperwall content available for the release of the new Pacific Flooding Analysis Tool. NASA Administrator Bill Nelson visited the Hyperwall on September 23 with Aarti Holla-Maini [UN Office for Outer Space Affairs (UNOOSA)—Director]. Karen St. Germain [NASA HQ—Director of the Earth Science Division], Julie Robinson [NASA HQ—Deputy Director of the Earth Science Division], Kate Calvin [NASA HQ—NASA Chief Scientist], Lesley Ott [GSFC— Climate Scientist], and Anjali Tripathi [NASA/Jet Propulsion Laboratory (JPL)—Astrophysicist] talked with delegates and members about NASA Science and accessed NASA global datasets. Photos from the event are available at the SSO Flickr Page.
Looking ahead, the SSO is once again leading the planning and logistics for the NASA exhibit at the American Geophysical Union (AGU) Fall Meeting, which will be held December 9–13, 2024 in Washington, DC. Nearly 40 NASA projects and missions will have hands-on activities within the perimeter of the NASA Science exhibit, from the James Webb Space Telescope to the Airborne Science Fleet. The NASA Hyperwall, a video wall used for visual-forward science storytelling, will host approximately 50 Hyperwall stories and presentations throughout the meeting, including presentations delivered by the 2024 winners of the NASA-funded AGU Michael H. Freilich Student Visualization Competition. The exhibit will also feature roughly 40 tech demonstrations throughout the week, covering a wide range of hands-on introductions to everything from the capabilities of the OpenSpace data visualization software to the scientific applications of augmented reality. Please be sure to stop by the NASA exhibit when you are at AGU.
Steve Platnick
EOS Senior Project Scientist
Share
Details
Related Terms
What's Your Reaction?





.jpg?#)


