


.jpg?#)


GPM Celebrates Ten Years of Observing Precipitation for Science and Society
Introduction On February 27, 2014, the four-ton Global Precipitation Measurement (GPM) Core Observatory (CO) spacecraft launched aboard a Japanese H-IIA rocket from Tanegashima Space Center in southern Japan. On that day, the GPM mission, a joint Earth-observing mission between NASA and the Japan Aerospace Exploration Agency (JAXA), began its journey to provide the world with […]

40 min read
GPM Celebrates Ten Years of Observing Precipitation for Science and Society
Introduction
On February 27, 2014, the four-ton Global Precipitation Measurement (GPM) Core Observatory (CO) spacecraft launched aboard a Japanese H-IIA rocket from Tanegashima Space Center in southern Japan. On that day, the GPM mission, a joint Earth-observing mission between NASA and the Japan Aerospace Exploration Agency (JAXA), began its journey to provide the world with an unprecedented picture of global precipitation (i.e., rain and snow). GPM continues to observe important precipitation characteristics and gain physical insights into precipitation processes using an advanced radar and passive microwave (PMW) radiometer on the GPM–CO along with leveraging a constellation of satellites. (The Earth Observer reported on the GPM–CO launch and plans for the mission in its November–December 2013 issue – see GPM Core Observatory: Advancing Precipitation Instruments and Expanding Coverage.)
As GPM is now well into its 10th year in orbit, the time is fitting to reflect on and celebrate what this mission has accomplished and showcase its contributions to science and society. While occasionally dealing with equipment malfunction, the GPM–CO has operated nearly continuously over its lifetime and recently was put into a higher orbit to conserve station-keeping fuel. As a result, GPM remains in extended operations and continues its observations after 10 years, making significant advances in the precipitation field through improving sensor calibration, retrieval algorithms, and ground validation measurements. GPM data continues to further our understanding of the characteristics of liquid and frozen precipitation around the world and improving our scientific knowledge of Earth’s water and energy cycles. These advances have extended to numerous societal benefits related to operational weather prediction, situational awareness and prediction of extreme events, hydrological and climate model development, water resource and crop management activities, and public health alerts. Additionally, this information has informed the K–12 and post-secondary audiences, influencing the next generation of scientists. More information is available at NASA’s GPM website.
Advancing Precipitation Measurements: The Need for the GPM Mission
Precipitation is a vital component of global water and energy cycles and crucially impactful to life on Earth. The distribution, frequency, and extremes in precipitation affect everything from agriculture to the insurance industry, to travel and your weekend plans. Prior to the meteorological satellite era, precipitation observations were limited to populated areas leaving wide swaths of land and almost the entirety of the oceans (70% of Earth’s surface) unobserved. GPM builds on decades of advances in satellite precipitation observations.
Early precipitation observations from space (e.g., from the Nimbus series) used visible and infrared measurements that gave the first, approximate estimates. PMW radiometers, however, gave a next generation of more direct and improved precipitation measurement. The NASA–JAXA Tropical Rainfall Measuring Mission (TRMM), launched in November 1997, significantly advanced the field with the addition of a Precipitation Radar (PR) alongside a wider-swath PMW radiometer. This was groundbreaking for precipitation research and advancement of measurement techniques, but was limited to the tropics and a single satellite in low Earth orbit. To move toward the goal of a globally distributed, high-frequency, physically consistent satellite precipitation product a new mission design was conceived in GPM.
The GPM Mission: Science Requirements, Objectives, and Instruments
The GPM–CO spacecraft is an advanced successor to the TRMM spacecraft, providing additional channels on both the Dual-frequency Precipitation Radar (DPR) and the GPM Microwave Imager (GMI) to enhance capabilities to sense light rain and falling snow. The GPM–CO, another NASA–JAXA partnership, operates in an inclined, non-Sun synchronous orbit that allows the spacecraft to sample precipitation across all hours of the day, as did TRMM. However, TRMM only covered tropical and subtropical regions, while the GPM–CO also covers middle and sub-polar latitudes.
The GPM mission has several key scientific objectives, including:
- advancing precipitation measurements from space;
- improving our knowledge of precipitation systems, water cycle variability, and freshwater availability;
- improving climate modeling and prediction;
- improving weather forecasting and four-dimensional [4D – i.e., three-dimensional (3D) spatial plus temporal] reanalysis; and
- improving hydrological modeling and prediction.
GPM Core Observatory Instruments
The GMI and DPR instruments together provide a powerful synergistic tool to assess precipitation structure, intensity, and phase globally at relatively high (regional) spatial resolutions. The DPR’s Ku-band (13.6 GHz) and Ka-band (35.5 GHz) channels provide 3D retrievals of precipitation structure with a vertical resolution of 250 m (~820 ft) and a horizontal resolution of ~5 km (~3 mi) across a swath up to 245 km (152 mi). The GMI is a 13-channel conically scanning PMW radiometer providing observations across a wide swath [885 km (~550 mi)] to estimate precipitation estimates at resolutions as fine as 5 km – see Figure 1.
When scientists and engineers collaborated on the design of GMI, they knew it would need to meet exacting requirements so that its data could be used both to support development of precipitation retrieval algorithms and to provide a calibration standard for the partner sensors in the GPM constellation. The attention to detail has paid off. To this day, GMI is deemed to be one of the best calibrated conically scanning PMW radiometers in space.
Together, these two well-calibrated GPM–CO instruments gather scientifically advanced observations of precipitation between 68°N and 68°S – which covers where the majority of the Earth’s population falls. This coverage allows opportunities to observe both surface precipitation rates and 3D precipitation structure and allows observations of diverse weather systems, including hurricanes and typhoons (e.g., from formation to their transition from the tropics to midlatitudes), severe convection, falling snow, light rain, and frontal systems over both land and ocean.

GPM Constellation
While the GPM–CO is a key component of the GPM mission, another fundamental component is the constellation of national and international partner satellites known as the GPM Constellation, which has numbers ~10 at any given time – with the current members listed at the link referenced above. Each GPM Constellation partner designed and operated the satellites for their own particular missions, but they agreed to share the data from their missions to enable the next-generation of unified global precipitation estimates. The combination of these partner satellites and the GPM–CO allow frequent intersections of their orbits, permitting colocated and cotemporal observations to be made, which are crucial to ensure effective intercalibration.
The GPM–CO serves as the “calibrator” to unify precipitation estimates across these different partners’ satellite sensors, ensuring that the observed microwave brightness temperatures (TB) are consistent among the sensors with expected differences after accounting for variations in the observing frequencies, bandwidths, polarizations, and view angles. The advanced calibration across the sensors is a remarkable achievement, and it allows the project to focus on the precipitation products rather than TB uncertainties. This careful calibration enables high-quality datasets that support and enable detailed investigations on the distribution of precipitation and how these patterns change over days, seasons, and years, enabling a breadth of science and societal applications at local and global scales.
Ground Validation Activities: Significant Contributions to the GPM Mission
An integral part of a successful satellite mission is a robust and active ground validation (GV) program. During the TRMM era, the TRMM PR, and/or the TRMM PMW radiometer instruments limited GV to simple comparisons of rain rates to surface measurements from radars and/or rain gauges, which is referred to as statistical validation. It soon became obvious that a more robust GV program would be needed to better aid future satellite algorithm developers to improve the physics of their algorithms rather than just justifying tweaking their outputs. As a result, unlike TRMM, GPM’s GV program has been part of the mission concept from its inception. The GPM team developed a three-tiered approach that uses: statistical validation, as done during TRMM; physical validation, where the emphasis is on better understanding of the physics and microphysics of different precipitating systems; and hydrological validation, which emphasizes improving precipitation retrievals over large-scale areas (e.g., watersheds).
To address these goals, there have been several pre- and post-launch field campaigns conducted. In chronological order, these include the:
- Light Precipitation Evaluation Experiment (LPVEx), a prelaunch field campaign taking place in September and October 2010 over the Gulf of Finland;
- GPM Cold Season Precipitation Experiment (GCPEX) over and near the Ontario, Canada/Great Lakes Environment Canada Centre for Atmospheric Research Experiments (CARE) from January 17 to February 29, 2012;
- Mid-Latitude Continental Convective Cloud Experiment (MC3E) in north–central Oklahoma, April 22 to June 6, 2012;
- Iowa Flood Studies (IFloodS)) in eastern Iowa, May 1 to June 15, 2013;
- Integrated Precipitation & Hydrology Experiment (IPHEx) from May 1 to June 15, 2014, in the mountains of central North Carolina; and
- Olympic Mountain Experiment (OLYMPEX), the last full-scale, postlaunch, and GPM-sponsored field campaign – and one of the most logistically challenging – conducted over the Olympic Peninsula and adjacent waters from November 1, 2015 to January 31, 2016.
Each of these field campaigns were designed to provide insight into different precipitation regimes and types to improve GPM satellite observations. For example, MC3E allowed for comprehensive observations of intense convection over continental regions. The researchers deployed an extensive network of ground instruments (e.g., radars, disdrometers, rain gauges), in coordination with flights of NASA’s ER-2 and University of North Dakota’s Cessna Citation II research aircrafts, to sample varied precipitation types (e.g., severe thunderstorms, Mesoscale Convective Systems (MCS)). Data from MC3E allowed for improvement of both active (DPR) and passive (GMI) retrievals over land. GCPEx has allowed for sampling of snowing systems. During this campaign, NASA’s ER-2 flew high above the clouds in coordination with NASA’s DC-3 aircraft flying within the clouds. Here again, GCPEx participants deployed a vast network of ground instruments (e.g., snow gauges, disdrometers). The goal for GCPEx was to formulate and validate frozen/mixed precipitation retrievals from the GPM satellite. (Note that from 2011–2015, The Earth Observer published articles on five of the six GV campaigns described in this section; the reader can locate these articles on The Earth Observer Archives Page. Scroll down to the “Bibliography of Articles with Historical Context Published in The Earth Observer” listicle and look for Field Campaigns.)
While these large-scale campaigns were extremely beneficial for achieving GPM science objectives, the costs of deploying instruments and personnel in these remote regions can be substantial. In order to provide long-term measurements at reasonable costs, the GPM GV established the Precipitation Research Facility (PRF) at the Wallops Flight Facility (WFF). The goal of this facility was to provide long-term measurements from the myriad instruments that have been deployed at the various field campaigns and manage them with full-time GV personnel. The linchpin of the PRF is NASA’s S-band, Dual-Polarimetric Radar (NPOL) – see Photo 1. NPOL was deployed in a farm field about 38 km (~24 mi) northeast of WFF to provide areal estimates of surface precipitation as well as profiles of precipitating systems above other GV surface instruments (e.g., profiling radars, disdrometers, and rain gauges). To add to this effort, the PRF staff established a network of rain gauges and disdrometers, which are deployed over the eastern shore of Maryland. These data are telemetered so that an added benefit to this effort is that the GPM GV data provide valuable, near-real-time data to many of the numerous farmers on the Delmarva Peninsula. The PRF’s principal activity is to design new GV instruments, test new validation methods, and assess instrument uncertainties using the abundant infrastructure of the GPM GV validation program. This coordination between GPM GV instruments, WFF-based staff, and regional data collection, quality control, and analysis are the core components of the PRF.

GPM Data Products
GPM data products and services have played an important role in research, applications, and education. The Precipitation Processing System (PPS) housed at NASA’s Goddard Space Flight Center (GSFC) produces and distributes GPM products that are archived and distributed at the Goddard Earth Sciences Data and Information Services Center (GES DISC) as well.
GES DISC is one of a dozen discipline-oriented Distributed Active Archive Centers (DAACs) that NASA operates for processing the terabytes of data returns from its satellites, aircraft, field campaigns, and other sources. (To learn more about Earth Science Data Operations, which includes the DAACs, see Earth Science Data Operations: Acquiring, Distributing, and Delivering NASA Data for the Benefit of Society. The Earth Observer, Mar–Apr 2017, 29:2, 4–18. A chart listing all the DAACs appears on pp. 7–8 of this article.)
In addition to precipitation estimates, users can access variables, such as calibrated TB, radar reflectivity, latent heating, and hydrometeor profiles in GPM products. See the Table 1 below for a listing of NASA GPM data products.
Table 1. Overview of GPM data collection.
Product Level
Products and Description
Level 1 (L1)1
1A – Reconstructed, unprocessed instrument data at full resolution for GPM GMI; TRMM TMI 1B – Brightness temperatures (Tb) for GPM GMI; and TRMM TMI, PR, and VIRS1C – Calibrated Tb for GPM GMI, TRMM TMI, and a constellation of PMW radiometers.
Level 2 (L2)2
2A Radar – Single-orbit radar rainfall estimates for GPM DPR, Ka, Ku; TRMM PR2A Radiometer (GPROF & PRPS) – Single-orbit PMW rainfall estimates from GPM GMI, TRMM TMI, and constellation radiometers; 2B Combined – Single-orbit rainfall estimates from combined radar/radiometer data (e.g., GPM GMI & DPR; and TRMM TMI & PR); and 2H CSH – Single-orbit cloud (latent) heating estimates from combined radar/radiometer data (GPM GMI & DPR, TRMM TMI & PR).
Level 3 (L3)3
IMERG Early Run – Near real-time, low-latency gridded global multi-satellite precipitation estimates; IMERG Late Run – Near real-time, gridded global multi-satellite precipitation estimates with quasi-Lagrangian time interpolation; and IMERG Final Run – Research-quality, gridded global multisatellite precipitation estimates with quasi-Lagrangian time interpolation, gauge data, and climatological adjustment. 3A Radar – Gridded rainfall estimates from radar data (GPM DPR, TRMM PR). 3A Radiometer (GPROF) – Gridded rainfall estimates from GPM GMI, TRMM TMI, and constellation PMW radiometers; 3B Combined – Gridded rainfall estimates from combined radar/radiometer data (GPM GMI & DPR, TRMM TMI & PR); 3G CSH – Gridded cloud (latent) heating estimates from combined radar/radiometer data (GPM GMI & DPR, TRMM TMI & PR).

List of acronyms used in Table (in order of occurrence): GPM Microwave Imager (GMI); TRMM Microwave Imager (MI); TRMM Precipitation Radar (PR); Visible and Infrared Scanner (VIRS); Dual-frequency Precipitation Radar (DPR); Ku-band and Ka-band channels; GPM Profiling Algorithm (GPROF); Precipitation Retrieval and Profiling Scheme Algorithm (PRPS); Integrated Multi-satellitE Retrievals for GPM (IMERG); Goddard Convective-Stratiform (CSH) (Latent) Heating Algorithm.
Detailed information of each product and links for data access and visualizations are available on NASA GPM Data Directory.
From the beginning, GPM was conceptualized as incorporating all available satellite data – not as a single-satellite mission. One of the key mission requirements of the PPS was to ensure that processing and reprocessing always include data from the TRMM era (starting in December 1997). Algorithm development would ensure that the same algorithm would be used to process both TRMM- and GPM-era data collected from the TRMM and GPM spacecrafts and the GPM constellation. As a result, an important part of this cross-mission processing is the intercalibration of PMW radiometers using GMI. Using data from the overlap period of GMI and TMI, TMI is intercalibrated to GMI and is then used to intercalibrate the radiometer data during the TRMM era. This intercalibration manifests itself in the intercalibrated brightness temperatures (Tc) provided in the Level 1C (L1C) product for each radiometer. The GPM Profiling Algorithm (GPROF) retrieval uses these intercalibrated L1C products and guarantees consistent mission intercalibrated precipitation retrievals. For example, the L2 product stage that converts TB into precipitation estimates applies the same GPROF to the GPM constellation of PMW radiometers.
Continued Improvement of GPM Algorithms
One important achievement of GPM is the continued improvements in GPM’s algorithms that produce the immense amount of precipitation data that are used by scientific researchers and stakeholders alike. GPM’s five algorithms – DPR-, GPROF-, Combined-, Convective-Stratiform Heating-, and Multisatellite – have all undergone version updates several times (e.g., Version 01–07), with additional updates planned for the next 1–4 years. Each update entails a tremendous amount of work behind the scenes from GPM’s algorithm developers to ensure that quality data are available to the public.
Each new version provides a complete reprocessing of the entire data record using the improved retrieval algorithms, based on validation against reliable GV data, feedback from users, new understanding of the processes, and improved techniques. This not only helps ensure a consistent data record and fair comparisons against past events but also helps refine and improve the data to capture precipitation phenomena more exactly. Just as an original photograph capturing a past event can be reanalyzed with new technology, reprocessing revisits the observed satellite instruments’ “raw” radiances and refines the process of converting them to the end product of precipitation quantities.
“We know more now about the global rain and snowfall in, say, 2010, than we did when it actually happened.” – George Huffman [GPM Project Scientist]
This process is an inverse problem that helps determine the physical quantities (e.g., precipitation rate) given the observed signal (e.g., microwave radiance). For precipitation, this retrieval process relies on complex algorithms and is by no means straightforward. This is an underconstrained problem where different combinations of physical quantities can give the same observed signal, especially for passive instruments. Thus it requires additional information or assumptions.
The aim of each version in GPM is to have “better” estimates of the precipitation variables than the previous version. However, what better means can involve trade-offs. An excellent example is a change implemented from V06 to V07 in one of GPM’s most widely-used products – the Integrated Multi-satellitE Retrievals for GPM (IMERG) algorithm – which is NASA GPM’s multisatellite product that combines information from the GPM satellite constellation to estimate precipitation over the majority of the Earth’s surface. The resulting IMERG products provide near-global precipitation data at a resolution of 10 km (~6mi), every 30 minutes covering latitudes of 60°N–60°S, and are available at different latencies (Early, Late, and Final, as defined in Table 1) to cater to a range of end-user communities for operational and research applications. IMERG is particularly valuable over areas of Earth’s surface that lack ground-based, precipitation-measuring instruments, including oceans and remote areas. Specifically, this change to IMERG V07 resulted in improvements towards the distribution of precipitation rates, allowing for a better representation of precipitation areas and extremes. However, it reduced correlation against ground reference data. Another example is the gauge adjustment process in IMERG that offers a substantial improvement at the expense of higher random error.
The result of these intricate reprocessing cycles is a family of precipitation products that improves accuracy, a longer record, and expanding coverage, all while responding to feedback and requests from users. This is especially the case for downstream products like IMERG, which is widely used for science and applications due to its completeness and regularity, and inherits the improvements in each reprocessing cycle across the family.
Meeting User Needs
The number one requirement on PPS was to provide well-curated standard reference products with carefully curated provenience. For each data product version, a complete record is kept of spacecraft maneuvers and issues, data input issues, and data formats. This makes GPM data products a standard against which others can be compared and the standard products themselves improved.
The GPM mission also requires near-real-time (NRT) products. As a research agency, NASA does not generally specify operational NRT requirements. Instead, these NRT products are usually provided on a “best effort” basis. During its core mission (the first three years), PPS did have NRT requirements. Since then, PPS continues to fulfill these as budget permits. The half-hourly 0.1 x 0.1º L3 global IMERG products are provided in NRT with latency objectives for the IMERG Early (Late) run of 4+ (14+) hours after data collection.
To facilitate data interoperability and interdisciplinary science, the PPS and the Goddard Earth Sciences Data and Information Services Center (GES DISC) have developed value-added data services and products since the TRMM era, including data subsetting (spatial and temporal), L3 data regridding, network common data form (NetCDF) format conversion, remote data access (e.g., via Open Data Access Protocol (OPeNDAP), Grid Analysis and Display System (GrADS) Data Server [GDS]), NASA GIS translation of GPM data for various accumulation periods, GPM Applications Programming Interface (API), and data visualization tools. For example, the more technical Hierarchical Data Formats (HDF) mission IMERG products are reformatted and accumulated to GIS-friendly additions in Geographic Tagged Image File Format (geoTIFF) format for both Early and Late Run IMERG products at 30-min, 3-hour, and 1-day temporal resolution. Other value-added products include the daily products for IMERG Early, Late, and Final Runs from GES DISC. Quick visualization tools, such as the IMERG Global Viewer, are freely available to the public to access and view the latest NRT GPM IMERG global precipitation datasets at 30-minute, 1-day, and 7-day intervals, on an interactive 3D globe in a web browser. User services and tutorials (e.g., Frequently Asked Questions, How-Tos, help desk, user forum) are also available across the GPM, PPS, and GES DISC webpages.
Along with the other DAACs, GES DISC is facilitating data access and use by migrating its products and services to NASA’s Earthdata cloud. Once the migration is finished, users will be able to access all NASA’s Earth data products from the 12 DAACs in one place, which can simplify interdisciplinary science studies. Over 50% of the archived GES DISC products have been migrated to the cloud as of this writing. Users can either access them directly in the NASA Earthdata cloud environment or download data in their own computing environment.
To broaden the GPM user community – especially for users who are either non-technical or not familiar with NASA data – GES DISC has developed an online interactive tool called Giovanni, for viewing, analyzing, and downloading multiple Earth science datasets (including GPM) from within a web browser, allowing users to circumvent downloading data and software. At present, GPM L3 precipitation products (IMERG) along with over 2000 interdisciplinary variables from other NASA missions or projects are available in Giovanni. Over 20 plot types are included in Giovanni to facilitate data exploration, product comparison, and research. Links to results and data can be shared with colleagues. Data in different formats (e.g., NetCDF, comma separated values, or CSV) can be downloaded as well. A list of referral papers utilizing Giovanni is available.
Data services continue to evolve to meet increasing user requirements, such as the Findable, Accessible, Interoperable, and Reusable (FAIR) guiding principles, open science, data integration, interdisciplinary science, and data democratization.
Science and Societal Application Highlights from 10 Years of Observing Precipitation with GPM
As scientists and stakeholder organizations have made use of GPM datasets for analysis and research over the past decade, myriad scientific discoveries have been made leading to the emergence of a wide variety of real-time and retrospective societal applications for GPM data. These GPM user communities continue to dig into scientific questions and provide time-critical decision support to the public. This portion of the article highlights several of the scientific and application achievements made possible since the mission launched in 2014. This list is not intended to be exhaustive, but rather demonstrates GPM’s unique accomplishments and what the mission offers for science and society.
Capturing Microphysical Properties and Vertical Structure Information of Precipitating Systems
One of GPM’s main charges was to provide microphysical properties and vertical structure information of precipitating systems using passive and active remote sensing techniques. Measurements of the vertical structure of clouds are fundamentally important to improving our understanding of how they affect both local- and large-scale environments. Achieving this goal has required considerable enhancement of the NASA GPM algorithms – including the DPR, GPROF, Combined (CMB), and Convective–Stratiform (Latent) Heating (CSH) algorithms – from their original capabilities at the time of launch.
The advanced instrumentation of GPM’s dual-frequency, Ku/Ka-band radar added new capabilities beyond the TRMM PR’s single Ku band. As a result, the DPR algorithms provide vertical hydrometeor profiles at the radar range bin level [~5 km (~3 mi) horizontal, 125 m (~410 ft) vertical]. Such detailed measurements are critical for classifying precipitation events (e.g., convective or stratiform) and characterizing the dominant types of precipitation particles, precipitation characteristics, and freezing level height. Additionally, these DPR algorithms have played a significant role in retrieving parameters of the particle size distribution (PSD) in rain. All of these factors help support and elucidate the understanding of storm systems and their impacts at local and regional scales.
More recently falling snow microphysics have received increasing attention. Characterizing snow remains a challenging problem for precipitation measuring/modeling due to varying particle habits, shapes, and snow mass densities. The higher frequencies added on both the DPR and GMI instruments have enabled improved observations of ice and snow, not only revealing new insights into the intensity and microphysical composition of cold-season precipitation but enabling an increased understanding of precipitation, clouds, and climate feedbacks.
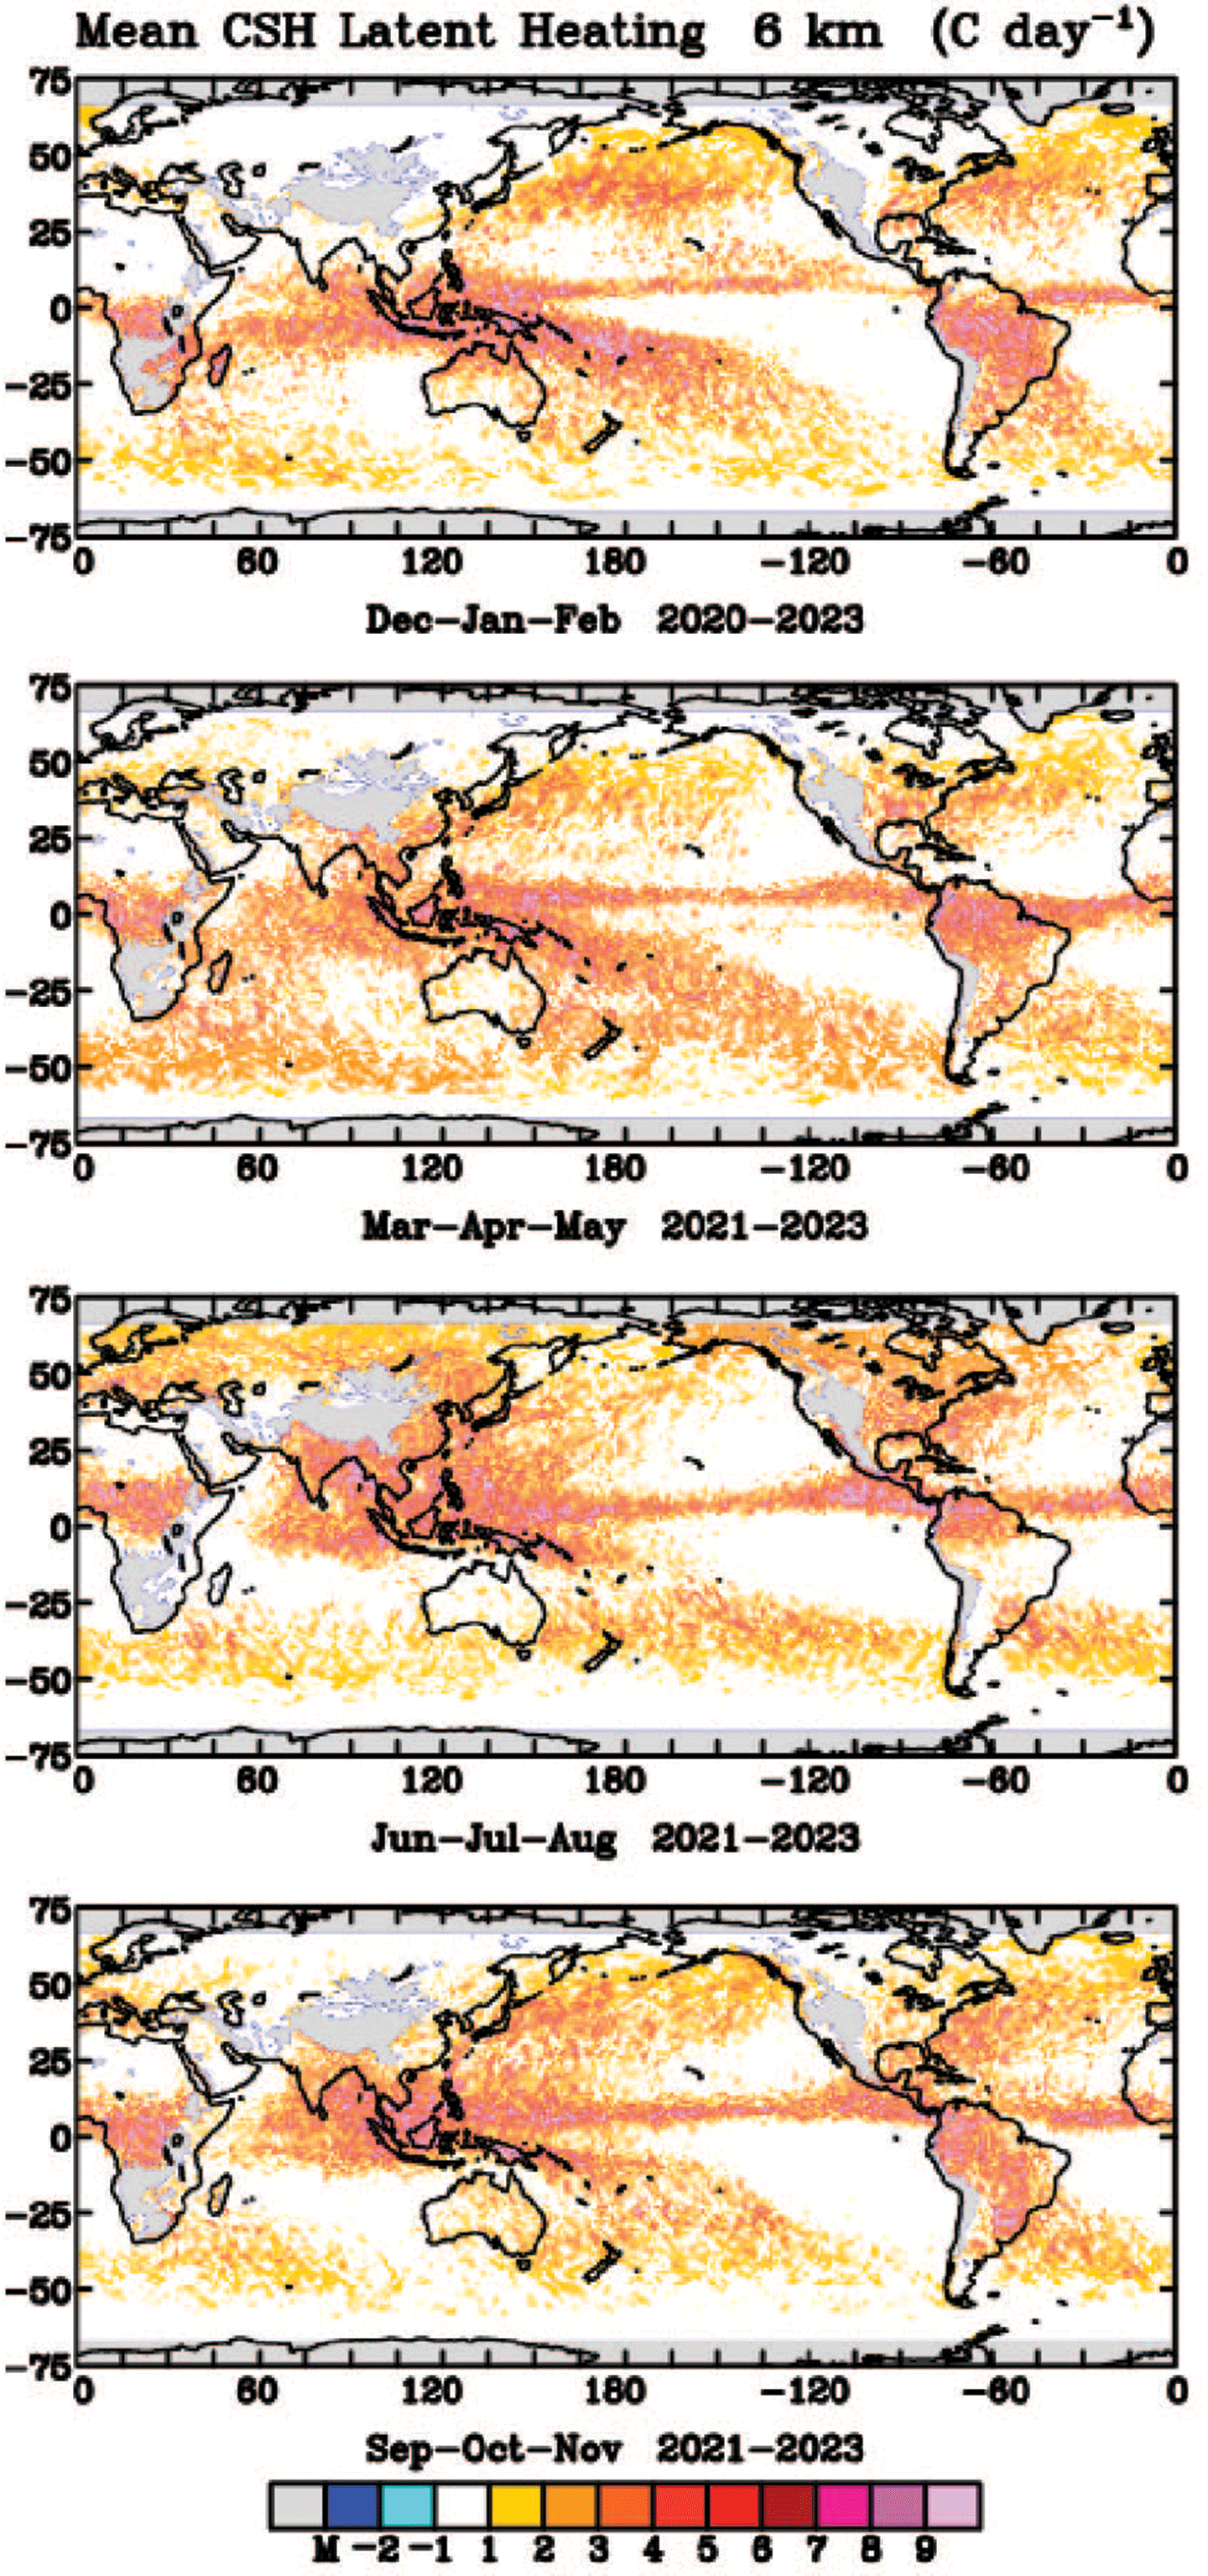
Another important parameter that is derived from GPM vertical profile information is latent heating (LH), which is so named because it measures the “hidden” energy when water changes phase but doesn’t impact its temperature. The vertical structure of LH is a key parameter for understanding the coupling of the Earth’s water and energy cycles. Although it cannot be directly observed, GPM-derived precipitation estimates, microphysical properties, and vertical structure provide critical information for inferring the vertical structure of LH – see Figure 2. Researchers can access this information using the U.S. Science Team’s CSH datasets as well as the Japanese Science Team’s Spectral Latent Heating (LSH) datasets. GPM’s sampling of higher latitudes – not available from TRMM – has resulted in estimates of the intensity and variability of 3D LH structures of precipitation systems beyond the tropics. The CSH algorithm has advanced during the GPM era due to improvements in numerical cloud models and higher accuracy vertical precipitation structure profiles.
Improve knowledge of Precipitation Systems, Water Cycle Variability, and Freshwater Availability
A key success of GPM – both from information from the GPM–CO and from combining with the information from the constellation satellites – is the expansion of knowledge of precipitation systems both in the tropics and at middle and high latitudes. In addition, the program contributes to water availability and variations in time and space. The radar and PMW instruments on the GPM–CO lead to the most accurate surface precipitation rate estimates and vertical structure of the systems, allowing researchers to study key features of these systems on an instantaneous basis and then compile precipitation statistics over time for accurate climatological determinations. The inclined orbit of the GPM–CO results in sampling the entire diurnal (day–night) cycle of precipitation, which is key information for validating numerical models. By combining the “best estimate” data from the GPM–CO with more frequent precipitation estimates from GPM constellation satellites results in the IMERG analyses (30-min resolution), which has allowed for the examination of fine-scale variations in all types of systems, the application of the IMERG NRT analyses for monitoring precipitation systems, and the use in a multitude of applications (e.g., hydrology, agriculture, and health) that depend on fresh water availability information.
In the tropics, the GPM–CO data have been combined with similar data from TRMM for a 25-year total observational record to study the rainfall structure and variations of tropical cyclones, the Intertropical Convergence Zone (ITCZ), and the mean rainfall climate of the tropics. Tropical mesoscale systems have been tracked with the 30-minute IMERG data to understand their life cycles and contributions to climatological rainfall. Tropical cyclone precipitation has been analyzed to understand storm initiation and variations with time over various ocean basins. Hailstorms have been studied with specifically developed hail algorithms over various continents, with particular focus on the extremely intense storms over South America.
In midlatitudes, the structure of large-scale cyclonic systems, including atmospheric rivers (ARs), have been examined, as well as their relation to moisture source regions and impact in driving heavy precipitation events. At higher latitudes, GPM’s focus on better precipitation retrievals – especially related to snow detection and estimation – has led to improved knowledge of storm systems in this important, changing environment.
Looking across the globe, extreme precipitation events – often with accompanying flood and landslide events – have also been examined and cataloged, both on a local and regional basis, but with increasing ability on a quasi-global basis as the time record extends forward.
On longer timescales, the GPM–CO (and TRMM) data have contributed to our knowledge and estimates of mean climatological precipitation providing different estimates (from different products) for intercomparison and through “best estimate” ocean climatological values using combined radar data and passive microwave information from GPM, TRMM, and CloudSat. This best estimate is used to calibrate a new, long-term Global Precipitation Climatology Project (GPCP) monthly analysis (1983–present), which has resulted in a refined estimate of the mean ocean climatological value, that fits global water and energy budget studies better – see Figure 3. The GPM IMERG analyses are also now used as a key input to the GPCP global daily analyses, enabling finer-resolution climatological studies.

GPM Precipitation Estimates Improving Climate Models and Constraining Predictions
The multifaceted, multiscale physical processes that affect precipitation locally and globally continue to be a challenge for climate models to accurately represent. Ongoing research and analysis reveals that the process-level representation is a much stronger constraint on climate model prediction fidelity than mean state climatological skill. Though high-quality climate models, such as the Coupled Model Intercomparison Project (CMIP), are currently not run at the resolution of GPM observations, they are increasingly simulating cloud and thunderstorm-scale rainfall as subcomponents within their lower-resolution grid boxes. This allows for the model-simulated rain intensity over thunderstorm areas to be compared with GPM precipitation estimates that are averaged over the equivalent GPM DPR-identified convective cloud types. This evaluation inevitably involves assessing extremes, and with 10 years and counting of GPM data now avaiable, such extremes in different weather regimes will be increasingly useful to study – see Figure 4.

Additionally, the diurnal cycle of precipitation – another challenge for climate models to simulate – remains an important focus. Recent studies have suggested that the systematic differences in cloud occurrence across the diurnal cycle are crucially important for atmospheric water vapor changes as well as cloud feedbacks and their role in climate change. This expanded understanding provides even more motivation for improving diurnal cycle representation in models. With the long GPM record, diurnal precipitation composites can be made in varying weather or climate states (e.g., El Niño/Southern Oscillation), and additional novel analyses of regime-dependent diurnal cycle composites will be important for constraining processes.
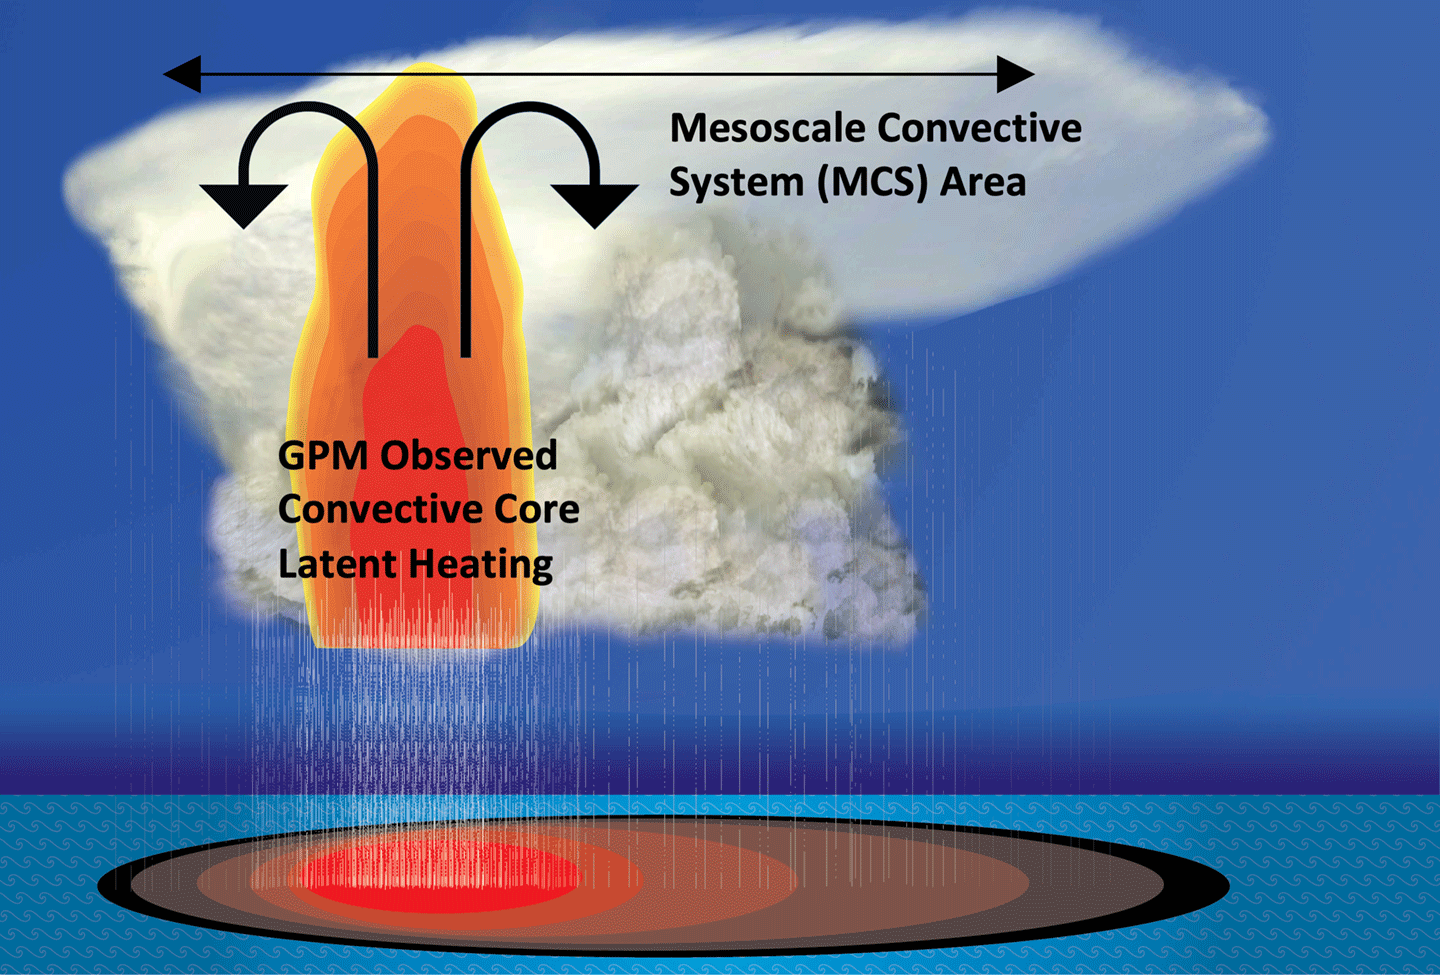
Availability of and improvements in GPM estimated stratiform rainfall will progressively enable addressing the longstanding deficiencies in simulating mesoscale convective systems – see Figure 5. Alongside use of “process-relevant” precipitation diagnostics, new efforts seek to use machine learning techniques to ensure that numerous climatological water and energy cycle diagnostics remain in good agreement with GPM and other satellite estimates. These joint efforts that leverage both mean-state global precipitation estimates plus the process-oriented precipitation diagnostics will ensure that coarser-resolution climate models that support numerous CMIP experiments will increase in predictive capability.
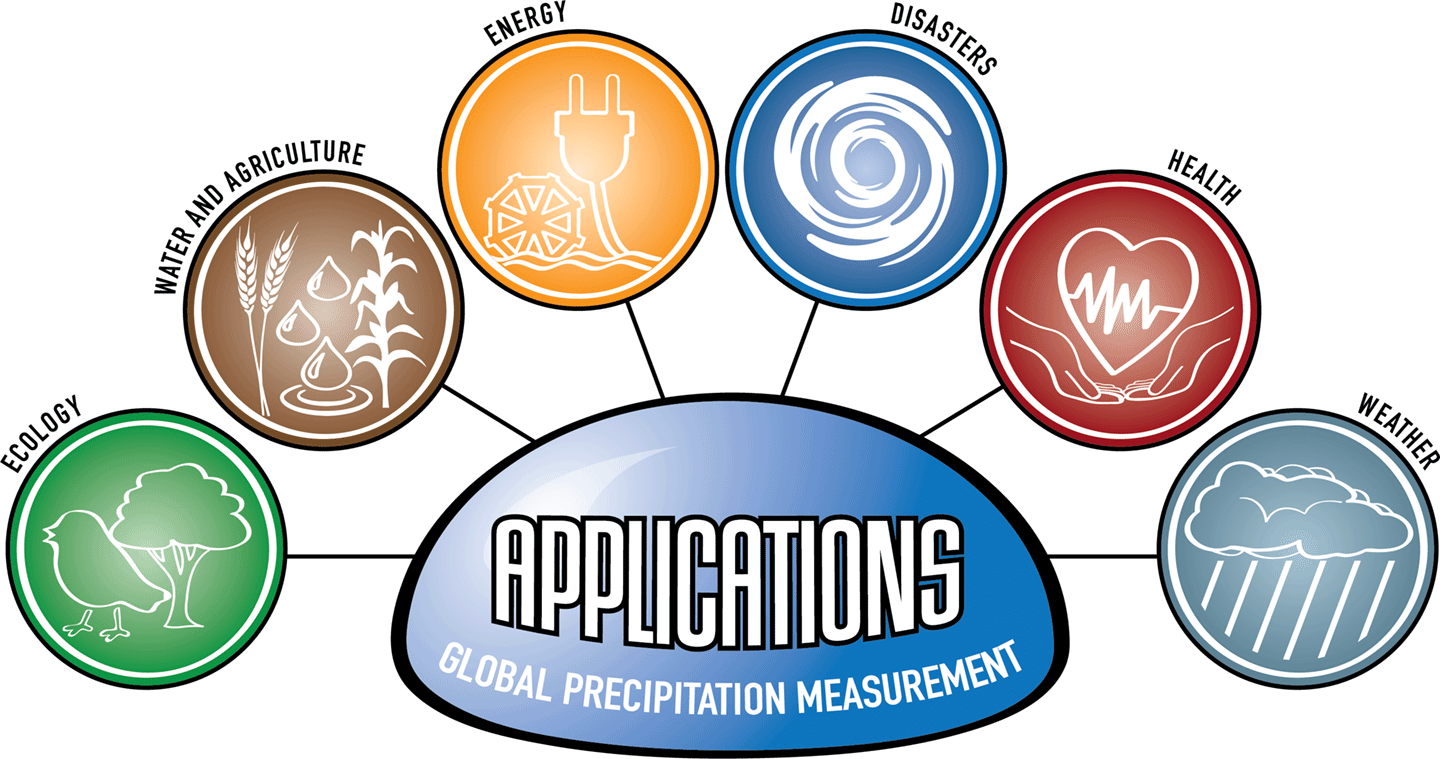
GPM Applications: Continuing to Grow and Enable Communities Across Local and Global Scales
As noted above, one GPM focus is the application of satellite precipitation estimates for societal decision-making. As a result, GPM data have supported applications such as weather forecasting, water resource management, agriculture and food security monitoring, public health, animal migration, tropical cyclone location and intensity estimation, hydropower management, flood and landslide monitoring and forecasting, and land system modeling – see Figure 6.
To support this focus, the GPM Applications team strives to focus on engaging users through trainings and interviews, workshops, webinars, and programs, with the objective of guiding new and existing users to integrate GPM data into their systems and processes to drive actions that positively impact society. These activities help elucidate data needs and identify data barriers faced by stakeholders. The team also helps identify opportunities and gaps to create effective engagement and outreach resources and help facilitate the use of GPM data to support decision making and improve situational awareness across different sectors. All of these efforts have helped increase the visibility of GPM and attract new users from federal and state partners, academic institutions, international agencies and non-governmental organizations (NGOs), and private and non-profit companies. A few examples of GPM Application engagement activities since launch include:
- three GPM Mentorship Programs that bridge the gap between GPM scientists and application communities to promote operational applications;
- seventeen GPM trainings to support new and existing users on data access and use for applications;
- six GPM stakeholder-driven application workshops to facilitate discussions between scientists and end users of GPM data about how NASA data could be better leveraged to inform decision making for societal applications; and
- three white papers that articulate and identify user needs and data requirements across communities.
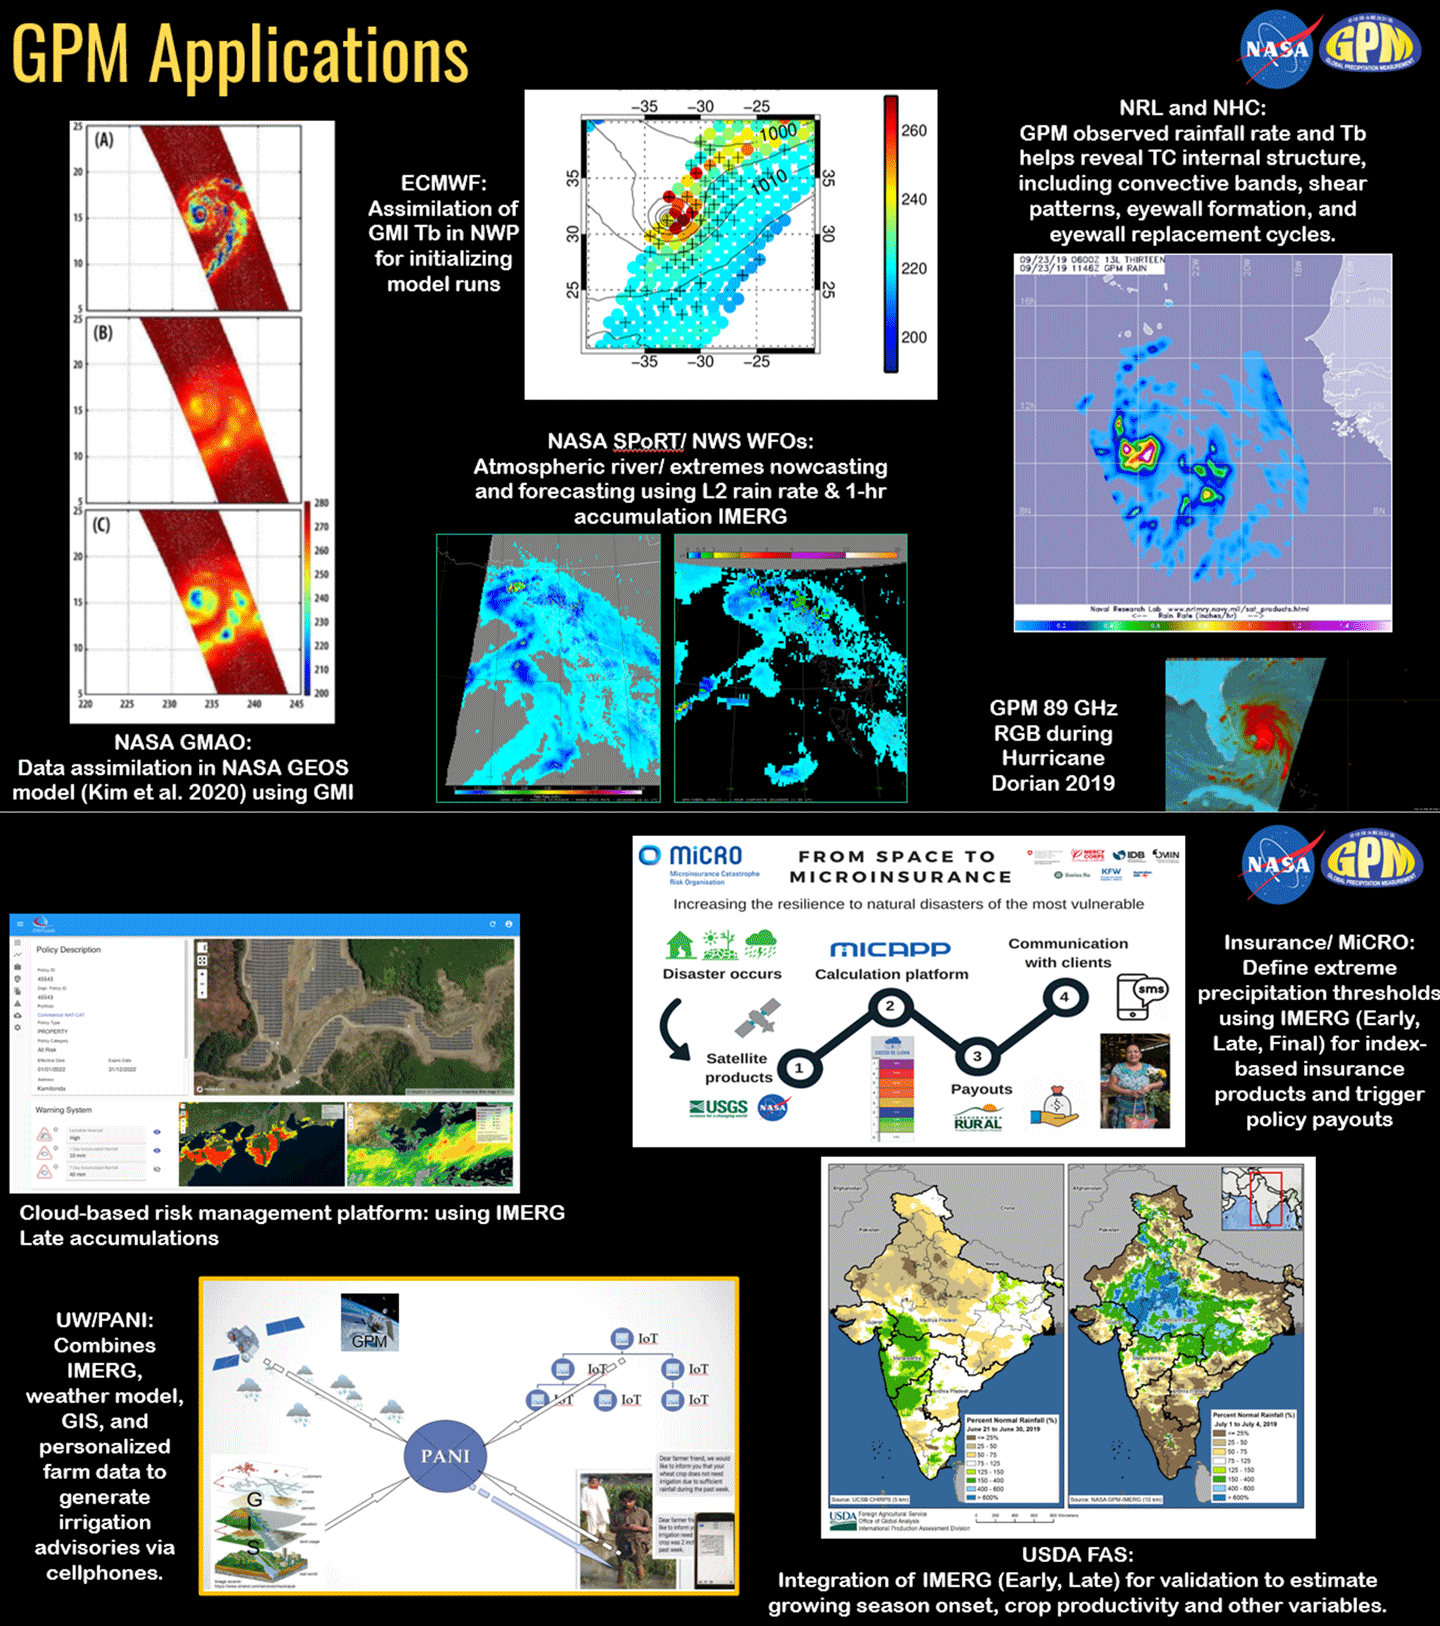
The GPM Applications team has tabulated over 10,000+ unique users across 130 countries who have accessed or routinely access GPM data from NASA data archives. Additionally, the value of these activities can be seen in over 175 GPM case study application examples that have been publicized at NASA, featured on social media and posted at NASA GPM Applications webpage, over the last 5 years alone – see sampling of applications in Figure 7.
Over the past decade of GPM observations, several themes have emerged with these efforts across the applications community. One key component of enabling GPM applications is the ability to access and download NRT data products that meet applications needs. About 40% of GPM end users rely on NRT GPM products for time-sensitive applications. Additionally, GPM’s global-gridded IMERG product plays a significant role for applications. It is used nearly 17 times more for research and applications compared to other GPM products, with ~30% of users accessing and downloading IMERG Early and Late NRT data and applying them towards operational uses. As noted earlier, the reprocessing of all TRMM precipitation-era data using the IMERG algorithm ensured a longer, continuous precipitation data record with consistent retrievals that are available from June 2000 to the present. The longer precipitation record has enabled new science research and data applications to benefit society across a diverse range of end-users, helping them to compare and contrast past and present data to support and develop more accurate climate and weather models, understand normal and anomalous extreme precipitation events, and strengthen the baseline information and situational awareness for applications, such as disasters, agriculture and food security, water resources, and energy production. Table 2 presents several broader examples of how these GPM data products are used for societal applications. The subsections that follow demonstrate the value of GPM data to facilitate research and applications even more through case studies.
Table 2. The table includes examples of user communities, by organizational sectors, that highlight how GPM data products are being used for situational awareness and decision-making. Application description includes type of GPM level products. For more information on level product definitions, see NASA Data Product Levels and GPM Data Directory.
User Community
Topic
Application of GPM Data
Meteorological agencies and organizations
Numerical weather prediction
Assimilation of Level 1 (L1) PMW TBs for initializing numerical weather prediction model runs to improve weather forecasts
Tropical cyclones
Improved characterization of tropical cyclone track and intensity using GPM L1 and L2 products to improve weather forecasts and provide more accurate hurricane warnings
Subseasonal to seasonal and climate modeling
Verification and validation of seasonal and climate modeling using L2 LH products and IMERG (Final) to improve understanding and predictability of climate behavior
Data-driven agriculture organizations
Agricultural forecasting and food security
Integration of IMERG (Early, Late) precipitation estimates within agricultural models to estimate growing season onset and crop productivity
Disaster risk management organizations
Flooding
Incorporation of IMERG (Early, Late) in hydrologic routing models for flood estimation
Disaster response and recovery
Situational awareness of extreme precipitation using IMERG (Early, Late) in potentially affected areas to support disaster response and recovery efforts
Disaster risk management platforms
Integration of IMERG (Early, Late, Final) into models to deliver real-time weather insights to customers
Energy infrastructure and management organizations
Renewable energy infrastructure and management
Assessment of freshwater inputs and quantification of water fluxes using IMERG (Early, Late, Final) as a precipitation data source for hydropower development, production, and flow forecasting
Reinsurance companies
Parametric insurance and reinsurance modeling
Definition of extreme precipitation thresholds using IMERG (Early, Late, Final) for developing multiperil index-based insurance products and improve situational awareness of rainfall to trigger policy payouts
Water resource management organizations and companies
Water resources and drought
Evaluation of precipitation anomalies using IMERG (Final) leveraging the extended temporal record, and assessment of freshwater input using IMERG (Early, Late) to basins and reservoirs to better quantify water fluxes
Public health
Vector- and water-borne disease monitoring
Tracking of precipitation variations using IMERG (Early, Late, Final) with other environmental variables to track and predict vector or water-borne diseases and issue public health alerts
Operational Numerical Weather and Hurricane Prediction
Looking towards the application of GPM L3 products, several agencies [e.g., the U.S. Air Force’s (USAF) Weather Agency (557th Weather Wing), Environment and Climate Change Canada (ECCC), and the Australian Bureau of Meteorology] use IMERG to support reanalysis of NWP models to conduct data assimilation and validation activities and as inputs to numerical models. For example, the USAF ingests IMERG Early into its operational weather forecasts and advisories, supporting global land surface characterization capabilities. This information is then provided routinely to decision-makers across the military, agricultural, and research sectors.
Water Resources, Agricultural Forecasting and Food Security
GMI L1 TB products are operationally assimilated into numerical weather prediction (NWP) models across the globe to improve short- to long-term weather forecast quality (by tuning and developing microphysics and convection parameterizations) and correct the track forecasts for tropical cyclones. Agencies and organizations, such as NASA’s Global Modeling Assimilation Office (GMAO), the National Oceanic and Atmospheric Administration’s (NOAA) National Hurricane Center (NHC), Naval Research Laboratory (NRL), and European Centre for Medium-Range Weather Forecasts (ECMWF) ingest GMI TB data to support their operational systems. For example, the all-sky assimilation of GMI Tb over ice-free ocean surfaces helps improve initial conditions and overall forecast quality to ECMWF’s 24-hour forecasts, increasing not only the number of satellite observations assimilated but also the types of variables analyzed, such as hydrometeors (e.g., liquid cloud, ice cloud, rain, and snow).
GPM’s L2 precipitation and L3 IMERG products are used as input into hydrological and land surface models to better understand the land–atmosphere interactions and better predict and monitor water resources and agricultural output on scales ranging from days to years. For example, IMERG serves as a key component to Famine Early Warning Systems Network (FEWS NET) Land Data Assimilation System hydrology products that are designed to enhance agricultural monitoring in data-sparse regions and support humanitarian response initiatives. IMERG Early products are actively used as a data source for the U.S. Department of Agriculture’s Foreign Agricultural Service operations where IMERG estimates are routinely evaluated against World Meteorological Organization station data above 50˚N latitude for consensus to produce crop assessments in those regions and support extratropical agrometeorological crop monitoring. In the private sector, companies, such as Nutrien Ag Solutions, use IMERG Early precipitation estimates to capture and evaluate extreme precipitation events. This information is part of Nutrien’s daily delivery of weather content to the company and their clients, where these efforts help the clients prepare for potential disruptions across the global supply chain.
Disaster Response and Insurance
The IMERG spatial and temporal resolution – as well as the availability of the data across more than two decades – has been invaluable for examining precipitation extremes that may result in flooding, landslides, drought, and fires. These data provide key situational awareness for disaster response and recovery. Rainfall information has been developed in Web Map Service (WMS) and ArcGIS formats with Representational State Transfer (REST) endpoints so that they can be pulled into geospatial portals at Federal Emergency Management Agency (FEMA), the U.S. Army Geospatial Intelligence Unit and data management platform companies (e.g., CyStellar), and provided to the National Geospatial Agency, the State Department, and insurers. The IMERG product has also been critical to global disaster models, such as the near-global Landslide Hazard Assessment for Situational Awareness (LHASA) system, which uses NRT IMERG rainfall in a decision tree framework that issues a moderate or high landslide nowcast based on rainfall thresholds. The model is routinely updated with a latency of four hours. The LHASA versions are running routinely and used by U.S. agencies and international agencies and organizations, including the World Food Programme.
IMERG data are also being used at multiple reinsurance companies, including the Microinsurance Catastrophe Risk Organisation (MiCRO), to develop drought and rainfall indices using climatology data from IMERG.
Looking Across and Forward for Applications
Common themes that have emerged in stakeholder feedback include the need for continuity of data products, identifying uncertainty estimates, having easily accessible case study examples, and creating public trainings for data access and use. The Applications team works closely with GPM members and leadership to ensure that there are clear and open communication pathways across the GPM mission on engagement activities and to accelerate stakeholder feedback to GPM algorithm developers to aid in the improvement of GPM data products and services for the public. In addition, these insights can be used to formulate a framework for applications related to future mission planning, e.g., NASA’s Earth System Observatory missions.
Bridging the Gap Between Precipitation Measurements and the Public: A View into Outreach Efforts
Several years before the launch of GPM, the Education and Public Outreach (EPO) team was busy in the background, working to bring Science, Technology, Engineering, and Mathematics (STEM) into the classroom and taking advantage of the Next Generation Science Standards (NGSS) that were being implemented in curriculums across the U.S. The launch of GPM offered a perfect opportunity to showcase and amplify the incredible science and technology behind the GPM mission and the myriad of potential applications that could stem from its data.
Early in the GPM mission’s development, the GPM EPO team curated existing NASA educational resources related to the themes of Earth’s water cycle, weather and climate, technology behind Earth Observing missions, and societal applications. The EPO team created a website, entitled Precipitation Education that has been wildly successful from its launch. The team also developed a Rain EnGAUGE toolkit and engaged both formal and informal educators from around the world to host “Family Science Night” programs and implement some of the interactive activities that the team developed for these events. Thus, even before the launch of GPM, the EPO effort had momentum as team members shared the incredible ways in which NASA’s Earth observation systems were helping us to better understand and protect our home planet.
After launch, the EPO Team worked annually with international teams of “GPM Master Teachers.” This process selected teachers, who participated throughout the school year and received a small stipend for their work. They helped to align the science behind the GPM mission and other NASA Earth observation systems with the Global Learning and Observations to Benefit the Environment (GLOBE) program and developed many lessons and activities that were made available to educators around the globe.
The EPO team also worked with NASA’s Earth to Sky program, training National Park Service and other interpreters to understand the science behind the GPM mission, and to find ways to share this information in meaningful and relevant ways with their audiences across the U.S.
Newer activities have been developed to enable the general public to interact with open science as they follow a very easy “data recipe” to retrieve GPM precipitation observations since 2000 for their location. They are encouraged to use the GLOBE program’s app, GLOBE Observer, and take an observation of either a tree height or clouds. Contributors input the latitude and longitude from that location and find out how much precipitation fell for that location since 2000. This gives the participants the opportunity to collect data from the ground, and then look at satellite data for that same location to better understand the impact of precipitation in their local environment. GLOBE Participants can share their Tree Stories and Water Stories and compare their data with others around the world.
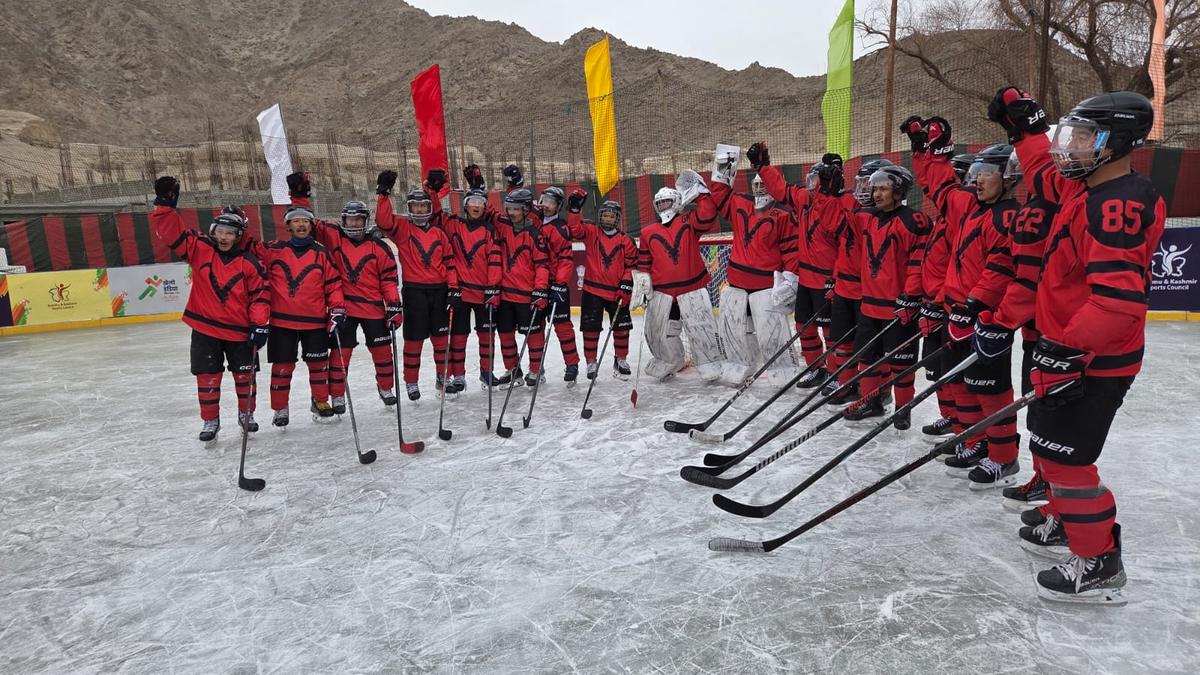
In addition to providing a wide suite of online resources, the GPM Outreach team attends many public events each year, ranging from large NASA-sponsored Earth Day events to local family STEM nights – see Photos 2 and 3. The GPM Outreach team has developed many hands-on activities that help the public explore the varied amounts of precipitation falling in locations around the world. By interacting with these activities and learning how NASA is helping us better understand and protect our home planet, participants walk away with a richer understanding of how NASA’s Earth science programs are improving life around the world.
A decade after the launch of GPM, the “Precipitation Education” website continues to be incredibly popular, with an average of 90,000 visits per month. GPM education and outreach resources are considered the state of the art among practitioners, and the team updates existing and adds new resources as opportunities arise.


Conclusion
In more than 10 years of operations, the GPM mission has made incredible contributions in our understanding of global precipitation, from scientific studies to real-world, societal impacts through applications of the data products. With a robust validation program and successive algorithm improvements, our knowledge of precipitation distribution across the globe continues to advance. This has had measurable effects on global modeling and weather forecasting, real-time severe weather monitoring, education, and many other areas. With hardware continuing to function – and a recent fuel-saving orbit boost – GPM continues to add to this valuable data record. The community’s experience with GPM helps illustrate what new observations or combinations of observations will be needed in coming decades to advance precipitation science and maintain needed global monitoring. GPM’s cohort of researchers, instrument specialists, mission operators, and other key personnel across the community are providing the backbone of future mission development efforts.
Acknowledgements
The authors wish to acknowledge several contributing members of the Global Precipitation Measurement Science Team who played a part in writing this anniversary article. They include: Gerald Heymsfield, Dorian Janney, Chris Kidd, Steven Lang, Zhong Liu, Adrian Loftus, Erich Stocker, and Jackson Tan [all at GSFC]; David Wolff [NASA’s Wallops Flight Facility (WFF)]; Gregory Elsaesser [NASA Goddard Institute for Space Studies (GISS)/ Columbia University]; and Robert Adler [University of Maryland].
Andrea Portier
NASA’s Goddard Space Flight Center/Science Systems and Applications, Inc
andrea.m.portier@nasa.gov
Sarah Ringerud
NASA’s Goddard Space Flight Center
sarah.e.ringerud@nasa.gov
George J. Huffman
NASA’s Goddard Space Flight Center
george.j.huffman@nasa.gov
Share
Details
Related Terms
What's Your Reaction?